
Updates
on everything Geocodio
FFIEC Income Indicator Layer Added to Maps
New layer includes Census tracts that are shaded based on their income level
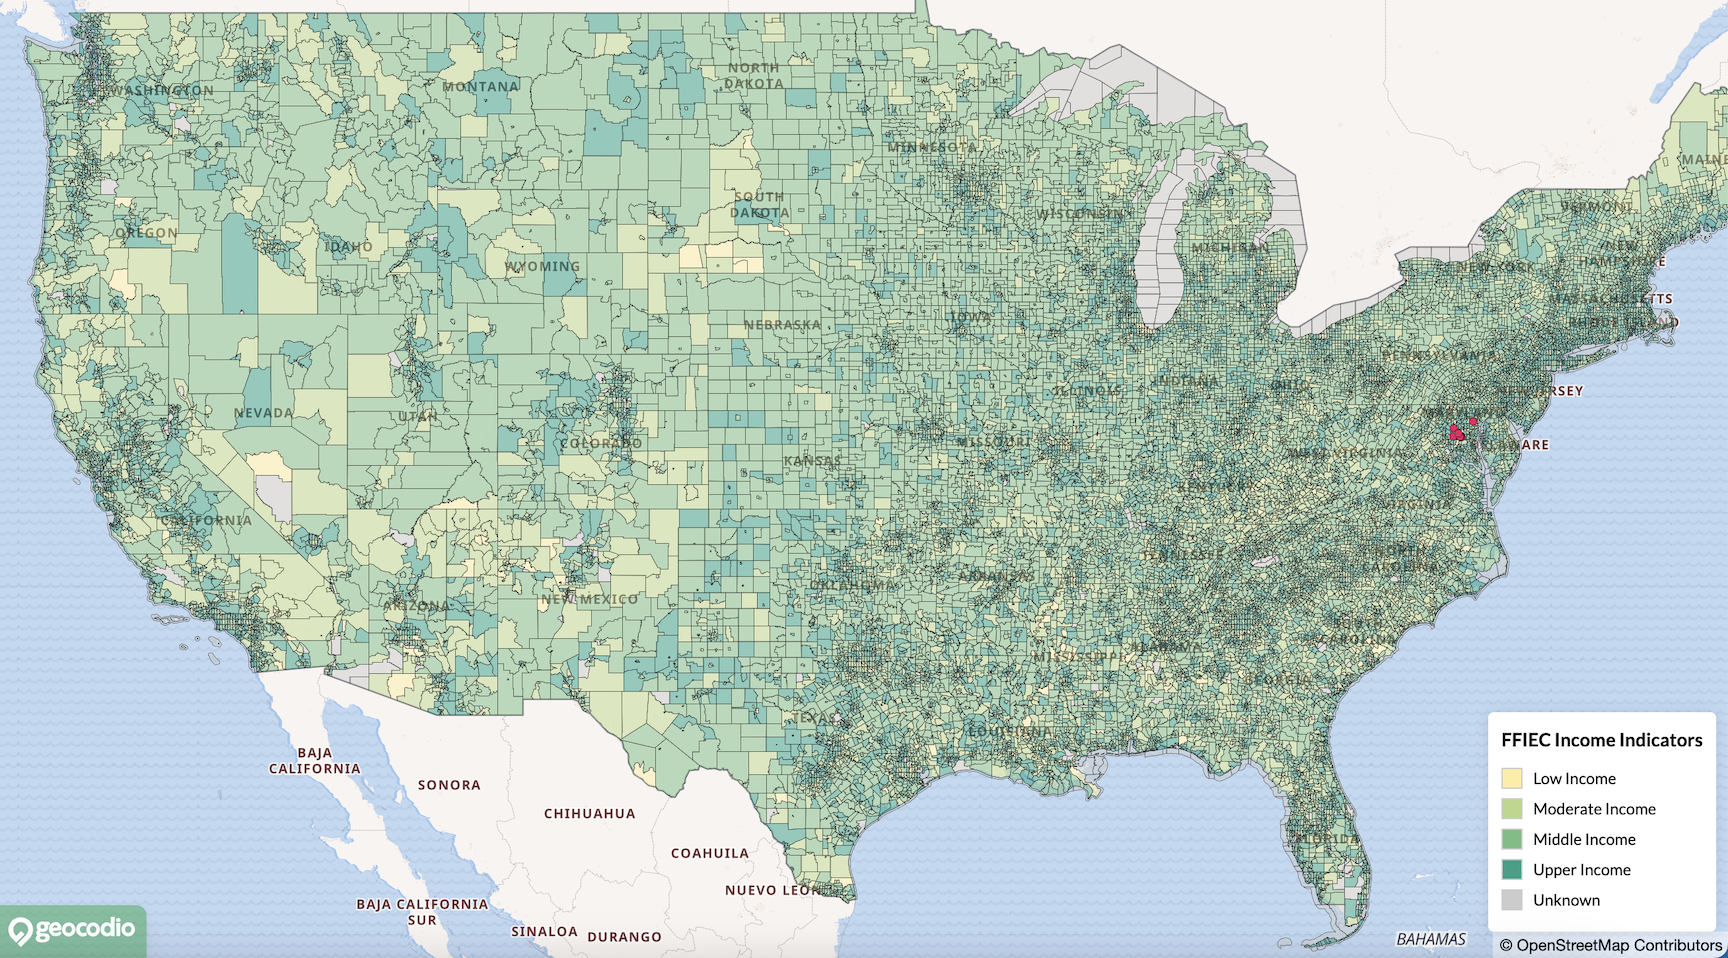
Visualizing FFIEC Income Indicators
Within our Geocodio Maps feature, customers can now access the new FFIEC Income Indicators layer: a collection of Census tract boundaries that are shaded based on their income level. The layer can be added as a standalone or on top of existing address markers or layers. These colorized Census tracts allow you to determine the income level of a specific location based on available FFIEC data.
A New Type of Map Layer
In order to implement this option, we constructed a new type of layer called a Choropleth layer.
Our standard layers only factor in the geographics boundaries of the selected option (i.e. states, counties, Congressional districts, Census tracts, etc) - with other factors such as fill color and opacity being customizable.
Choropleth layers take into account outside factors - in this case FFIEC Income Indicator data - and use this additional information to pre-render specific styling options. This means that certain customization options that are available in other layers may be restricted when using Choropleth layers.
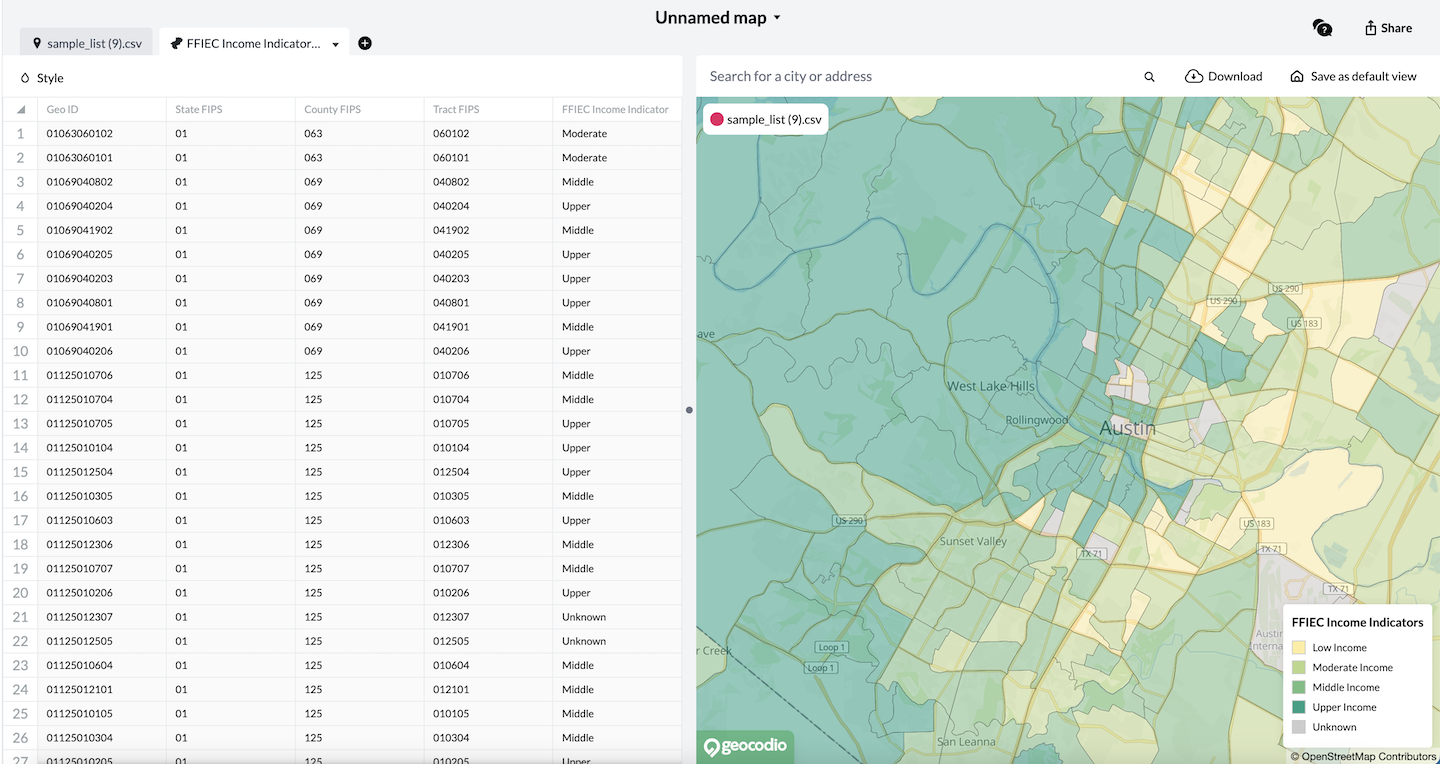
We also provide a legend in the bottom corner of the map so that you can easily match the color of a tract to its associated income level.
How to Add FFIEC Income Indicators
To add the FFIEC Income Indicators layers, navigate to the Maps section in your account dashboard and open an existing map or create a new one.
Once the map has loaded, click the plus-shaped button in the top-left corner of your spreadsheet and choose the "Add Layer" option.
A menu will open allowing you to select which boundary layer you would like to add to your map. Since there are quite a few options, it will be easier to find the FFIEC Income Indicators layer if we sort by Category: Census and Year: 2025.
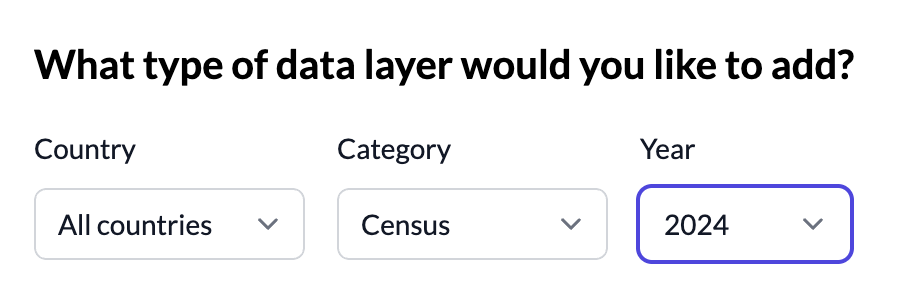
Note: All FFIEC Income Indicator data is based off of Census tract boundaries from 2024.
Once you've filtered out the excess options, scroll down until you find the "FFIEC Income Indicator" layer and click to load it on your map.
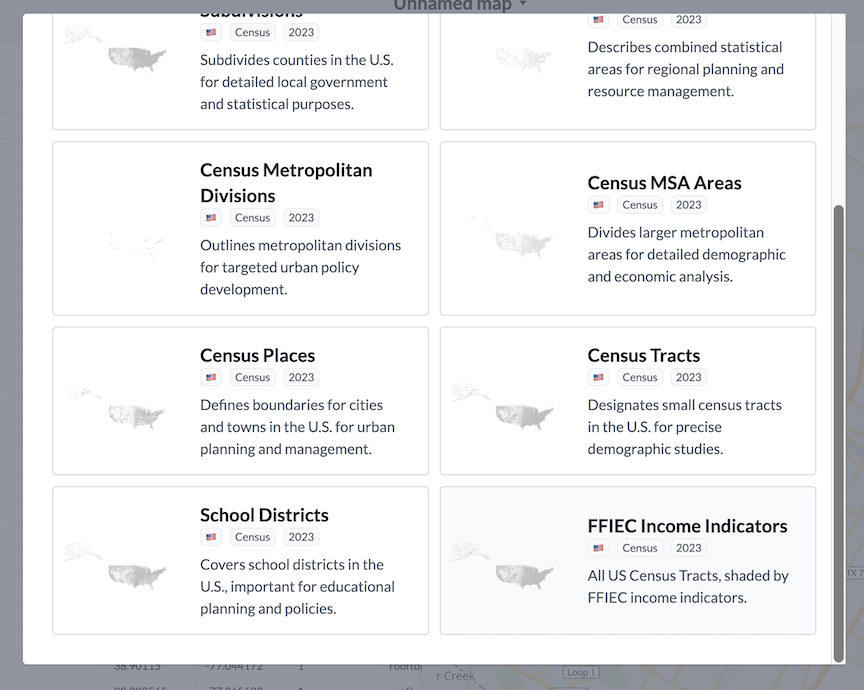
The layer and legend will be added to your map quickly.
If you have any questions about how to proceed, feel free to reach out to our support team.
Related
FFIEC Data Append Now Available In Beta
Customers now have access to key datapoints from the FFIEC flat file, including Income Level, Urban/Rural code and more.
Lists API Now Available for Enterprise
Enterprise customers can now upload a spreadsheet directly via the Lists API.
Ridings for Canada's 2025 Election
Updated electoral districts (ridings) are available for Canada's 2025 elections.
Don't miss what's new
Geocodio ships new features and data updates regularly. We'll only email you with the good stuff, nothing else.
Thanks for subscribing! Check your inbox to confirm.