Getting Started
What you can do with GeocodioSpreadsheet formattingAddress completionSpelling CorrectionFile sizesFile formatsIntersectionsPreviewing your spreadsheetReverse geocodingData Appends
Data Enrichment OverviewCensus Block/Tract/FIPS/GeoIDUSPS ZIP+4 (Full ZIP9)Congressional Districts & Contact InfoState Legislative DistrictsCensus: DemographicsCensus: Education & Veteran StatusCensus: FamiliesCensus: HousingCensus: IncomeFFIEC DataOCD IDsSchool DistrictsProvincial/Territorial RidingsFederal RidingsCanadian Census GeographiesTimezonesTroubleshooting
Country supportMissing coordinatesMap preview shows AfricaRow estimate too highSYLK ErrorTestingWhy are latitudes/longitudes slightly different when reverse geocoding?What happened to counties in Connecticut?What is a Census Block Group?Missing Leading Zeroes In SpreadsheetCongressional District 00 or 98Billing & Payment
Sales TaxesW-9Pay-As-You-Go CreditsEstimates/QuotesSet a usage limitWhat's a 'lookup'?When will I be charged?Styling Maps
Once you've added a spreadsheet to your map, you can style certain elements to your liking and customize its appearance to better visualize the data you've provided.
Style
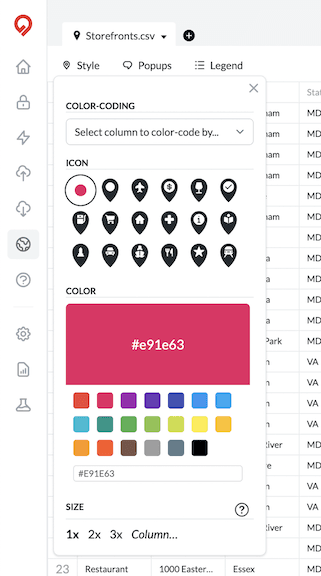
To style your markers, open the "Style" menu in the top left corner of the uploaded spreadsheet. You'll see a number of different options to choose from:
- Icon: Geocodio Maps defaults to a circular marker, but you can also select from a variety of other options that can better define the type of location the marker is pointing to.
- Color: Choose from a variety of preset colors for your markers or enter your own color code to customize the result.
- Size: You can adjust the markers between three different sizes.
Customizing Column Styles
If you've included a column in your spreadsheet that defines each of your addresses as part of a category, you can style and color code the categories separately to make your map more dynamic.
For example, if you had a column called "Business Type" and assigned a category such as "Restaurant," "Retail," "Office," "Contractor,", and so forth to each of your records, you could style each of these categories with different marker icons, colors and sizes.
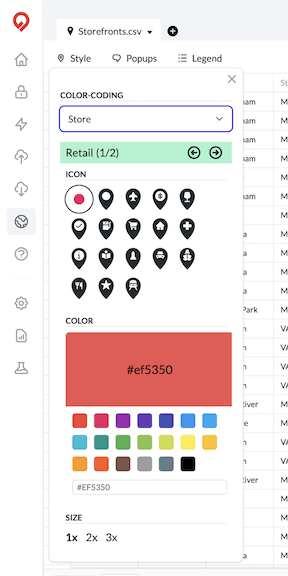
To do this, click the drop down menu at the top of the style menu and select the spreadsheet column that contains your categories. You'll see a window appear that should include a page for each of the categories. As you scroll through each option, you'll be provided the ability to style them one at a time. Each individual category can appear in whatever way is useful to you.
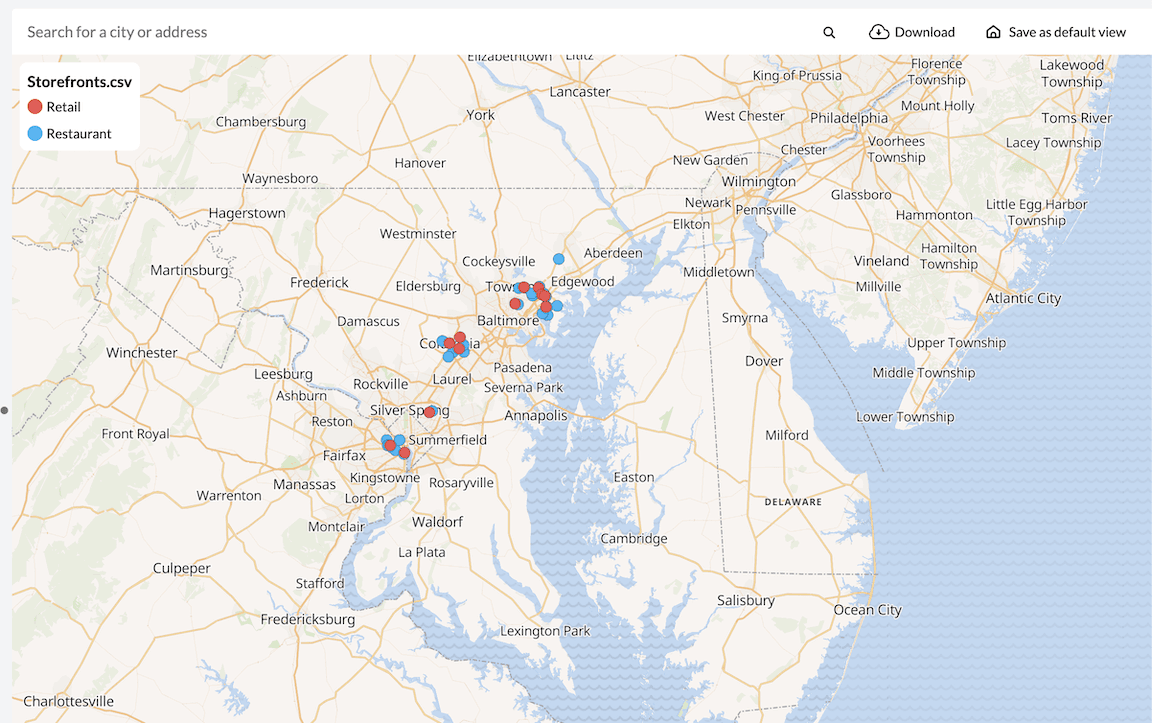
Here's an example of what a map with multiple categories might look like:
Popups
If you open the "Popups" menu, you can create a popup that will appear when you click on a marker on the map. You can type custom text in the text box or use the @ symbol to retrieve data from specific columns in your spreadsheet.
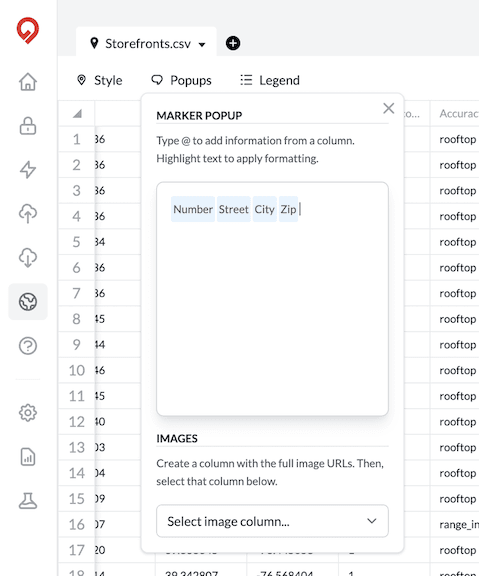
For example, if you had a "Formatted Address" column, you could enter @Formatted Address and we'll display that data for each individual point on your map.
If you have a column that includes image URLS, you can also display those images as part of the popup by selecting the image column in the dropdown form at the bottom of the menu.
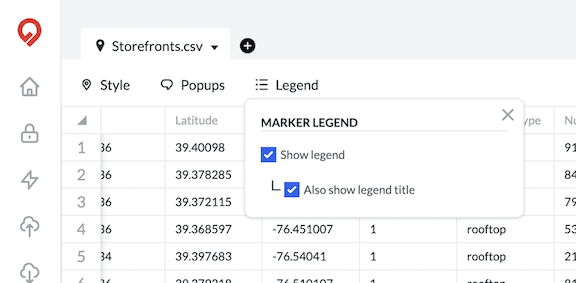
Legend
If you've customized multiple categories, we automatically provide a legend in the top corner of your map. This will break down any color coding or icons attributes to each category. You can turn this legend on and off by click on the "Legend" menu and toggling the checkbox within.